DNV GL, an authoritative international certification consulting organization has released their first report on the outlook for energy transformation in Chinese edition during CWP2017 (China Wind Power), which mainly discussed the renewable energy, electricity and energy use. According to DNV GL world energy system modeling, we are led by a new society with abundant resources and cleaner energy. By the year of 2050, the electricity consumption will increase 140% and becomes the largest energy carrier. Also, by the year of 2050, 85% of the global electricity generation comes from renewable energy. And solar photovoltaic and wind energy will take the lead.
Wind Power Cost is No Longer A Constraint of Wind Energy Development
According to the prediction of DNV GL model, the installed capacity of wind turbines will continue the accelerated growth. By the years of 2020, 2030, and 2050, the wind turbine installed capacity will reach 670GW, 2000GW, 9000GW respectively. By the year of 2030, the annual new wind turbine installed capacity will reach 200GW. Between 2030 and 2050, the growth rate of wind turbine installed capacity will keep increasing, especially for onshore wind turbine tower system.
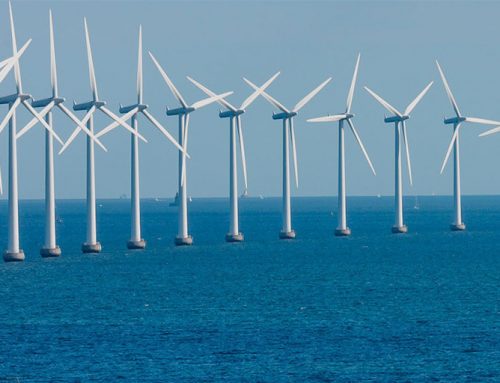
The report shows that onshore wind turbine installed capacity is much larger than offshore wind turbine installed capacity. And the installed capacity of Chinese wind turbine grows much faster than European and North America areas. About offshore wind turbine tower systems, the installed capacity of offshore wind turbine tower systems in China will reach 33% of global offshore wind turbine system installed capacity.
DNV GL model shows a fact that wind power cost is no longer a constraint of wind energy development. With more and more stakeholders realize this new fact, the construction of both onshore and offshore wind farms will be more and more popular.

The Cost of Electricity From Renewables
The cost of electricity generation partially determines the development speed of the electricity generation method. The reduction of electricity generation cost can help the development of wind energy. Traditionally, we all think that wind energy generation cost is much higher than conventional energy cost. Even for electricity from renewables, wind power is also the expensive one. With the authoritative statistics of different electricity generation technology costs, we can have a rational knowledge about wind energy cost.
2010-2015 Global Electricity From Renewables Average Cost
According to the statistics of IRENA (International Renewable Energy Agency), the average cost of global electricity from renewables from 2010 to 2015 are:
Hydroelectricity: the hydroelectricity cost is stable in recent years. In 2010, the cost of hydroelectricity is about 4.6cent/kwh, in 2015, the cost of hydroelectricity is also 4.6cent/kwh.
Onshore wind energy: onshore wind energy cost reduces 15.5% from 2010 to 2015. In 2010, the cost of onshore wind power generation is about 7.1cent/kwh, and the average cost of onshore wind power reduced to 6cent/kwh in 2015.
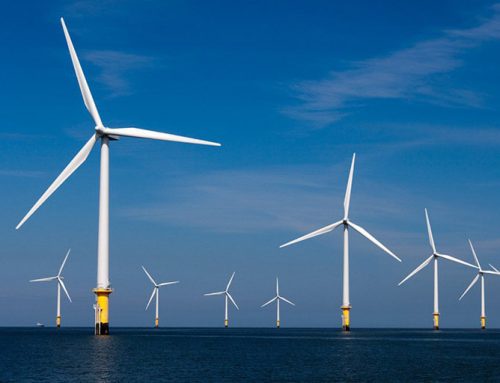
Offshore wind energy: unlike the onshore wind energy cost, offshore wind energy average cost doesn’t change from 2010 to 2015. The average offshore wind energy cost is 15.7cent/kwh in 2010. In 2015, the average offshore wind energy cost stays the same.
Photovoltaic: from 2010 to 2015, the global average photovoltaic cost reduces 55.8%. In 2010, the average cost is 28.5cent/kwh. By the year of 2015, the cost reduces to 12.6cent/kwh.
Solar thermal: The average cost of solar thermal also reduces in the past years. The solar thermal cost in 2010 is 33.1cent/kwh, and in 2015, this cost reduces to 24.5cent/kwh. Even though the cost is still higher than other renewables, with the development of solar thermal technology, the cost of solar thermal will keep reducing in the following years.
Biomass: the cost of biomass power generation reduces 16.7% from 2010 to 2015. In 2010, biomass power generation cost is 6.6cent/kwh, and in 2015, the average biomass power generation cost is 5.5cent/kwh.
Geothermal: unlike other renewable energies cost, the cost of geothermal increases 12.6% from 2010 to 2015. In 2010, the geothermal cost is 7.1cent/kwh, but in 2015, the global average cost of geothermal is 8cent/kwh.
US Electricity Generation Cost 2017
Lazard has released their annual energy cost report recently. The statistics below are from Lazard Levelized Cost of Energy Version 11.0.
Table 1 American Electricity Generation Cost 2017
| Renewables | Conventional Energy | ||
| type | cost (cent/kwh) | type | cost (cent/kwh) |
| rooftop pv | 18.7-31.9 | diesel engine | 19.7-28.1 |
| commercial rooftop pv | 8.5-19.4 | gas engine | 6.8-10.6 |
| community rooftop pv | 7.6-15 | gas power station | 15.6-21 |
| polysilicon pv | 4.6-5.3 | coal gasification | 9.6-23.1 |
| thin-film pv | 4.3-4.8 | nuclear | 11.2-18.3 |
| photo thermal | 9.8-18.1 | coal | 6-14.3 |
| fuel cell | 10.6-16.7 | natural gas | 4.2-7.8 |
| geothermal | 7.7-11.7 | ||
| biomass direct fired | 5.5-11.4 | ||
| wind energy | 3-6 | ||
From the above table, the median values of all kinds of electricity generation technology costs are wind power 4.5cent/kwh, photovoltaic 5.0cent/kwh, natural gas 6.0cent/kwh, coal 10.2cent/kwh, nuclear 14.8cent/kwh. Among all these electricity generation technologies, wind energy holds the lowest cost, which is suitable for large quantity power generation.